Performance Profiling Analysis using perf
While most of the stuff we analyze is Windows malware, when it comes to implementing detection or analysis approaches, we surely turn to GNU/Linux. One of the best tools I stumbled upon when it comes to profiling, i.e. analyzing the execution performance of C code under Linux is perf. Since most of the time we have to develop code that has to run fast, especially when dealing with carrier-grade network links of 10 GbE, profiling is inevitable. perf is extremely useful as it barely adds any overhead, is easy to use and precise. For example, in order to measure while running a userspace application, perf is called as easy as:
perf record -g ./application [params and args for the application]
On a multicore system, the performance overhead induced by perf while monitoring a single-threaded application is hardly noticeable. But the real magic lies within the simple yet powerful result reporing. In order to get a histogram of time spent in each function, it is as simple as
perf report
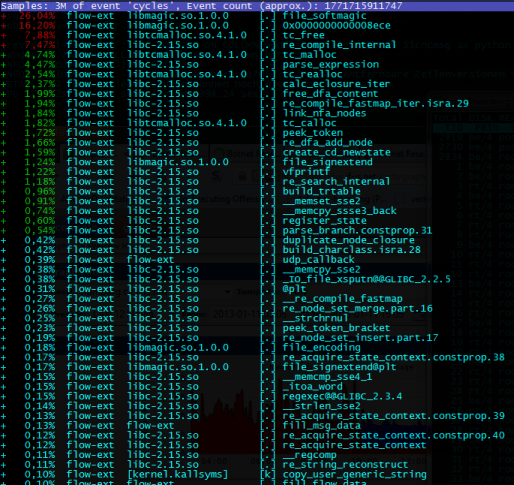
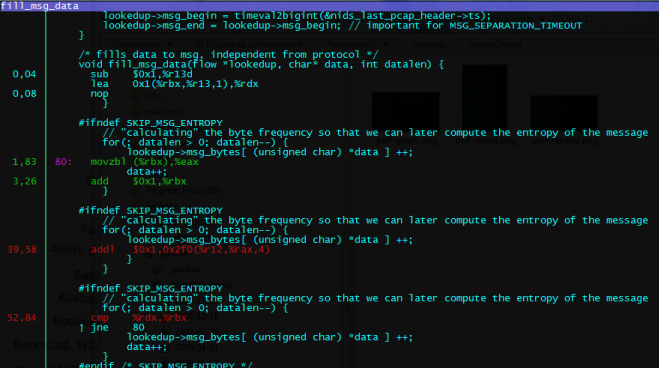
The first column shows the relative amount of time spent in the respective function. At the top, the functions where most computing time is consumed are displayed. This provides the developer with a quick view on the functions which potentially profit most from code optimizations. Thus, as shown in the example screenshot above I would dig into the libmagic stuff first. The console user interface is interactive and allows to navigate and dig down tree-structured call chains. In addition, it can annotate the assembly using the surrounding C source code, as shown here (simply press ‘a’):
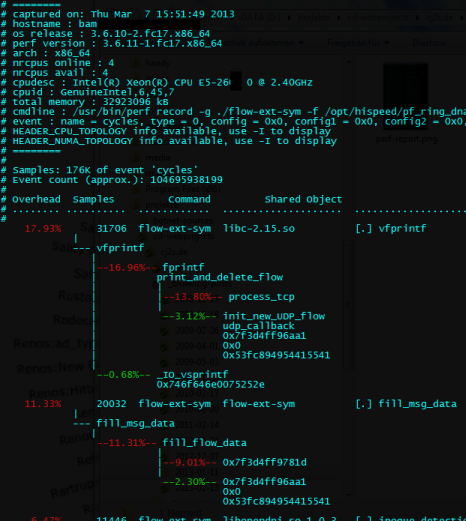
Finally, perf can print an annotated call graph snippet using
perf report -g
Note that the code should be compiled with -fno-omit-frame-pointer and -ggdb. To me, one of the results clearly indicated to use tcmalloc instead of the standard glibc malloc. I can really recommend profiling with perf.